A note of caution : The purpose of this blog is to highlight just one of the many aspects of ME/CFS that are lacking adequate data. It is not intended as a substitute for proper academic investigation and the population models presented below are illustrative only, they show what the age distribution of patients in the UK may be, given the present state of knowledge.
Although the worldwide population of CFS sufferers is suggested to be in the region of 20 million, there is very little research to tell us what the age distribution of that population looks like. Patient age is important not just for understanding who becomes ill, when patients become ill and how long they may remain ill, but also for understanding the type of support they are likely to have, the support they may need, their likely opportunities for employment, for leisure and for socialising, and the levels of the co-morbid illness they may have.
Prevalence and Incidence of ME/CFS
Studies of both the Prevalence (the total number of patients who have an illness at any one time) and Incidence (the total number of patients becoming ill in a given time period) of ME/CFS are limited in number and most are poorly powered or confused in terms of illness definition. For the illustrative purposes of this Blog five studies[Ref 1 -5] provide reasonably strong data, two provide Prevalence and Incidence data, two provide just Prevalence data and one just Incidence data.
Table 1
| Prevalence | Incidence | |
|---|---|---|
| a | n/a | 0.0285% |
| b | 0.2% | 0.015% |
| c | 0.235% | 0.018% |
| d | 0.42% | n/a |
| e | 0.29 | n/a |
In simple terms these figures suggest that in any given population, between 200 and 420 people out of every one hundred thousand people will have diagnosable ME/CFS at any one time, and that between 15 and 29 out of one hundred thousand people will be diagnosable with new onset ME/CFS in each 12 month period.
There is no simple relationship between Prevalence and Incidence in ME/CFS because there is a wide variation in the duration of the illness between patients, however we can see from the difference in the two rates that the duration of the illness must be long in at least a significant number of patients if the smaller incidence rates are to build up to the prevalence rates. If we imagine ME/CFS to be an entirely new diseases starting in year 1, and no patient ever recovers or dies, then the figures in Table 1 imply that it would take around 14 years for the new disease to produce the total prevalence numbers. Of course in the real world things are far more complicated, many people seem to recover from ME/CFS in timescales far shorter than 14 years, while some patients have the illness for a lifetime. And of course ME/CFS is not a new disease, although it has only been closely described for the last seven decades.
Patient age
Only a few studies have looked at the age distribution of those diagnosed with ME/CFS , typically research into ME/CFS has used an upper age cut off and consequently little is known about what the rates of ME/CFS are amongst older people nor how they are affected.
Table 2
| Reyes 2003 | Jason 1999 | Steele 1998 | Bakker 2014* | ||
|---|---|---|---|---|---|
| Age | Prevalence | Prevalence | Prevalence | Incidence* | Age |
| 10-19 | n/a | n/a | n/a | 0.037 | 10-19 |
| 18-29 | 0.05 | 0.32 | 0.24 | 0.025 | 20-29 |
| 30-39 | 0.18 | 0.41 | 0.20 | 0.035 | 30-39 |
| 40-49 | 00.37 | 0.80 | 0.30 | 0.026 | 40-49 |
| 50-59 | 0.50 | 0.41 | 0.25 | 0.014 | 50-59 |
| 60-69 | 0.13 | 0.35 | 0.17 | n/a | 60-69 |
| 70+ | n/a | n/a | 0.14 | n/a | 70+ |
One of the more difficult things to explain is the rapid fall in prevalence in the 60+ age group as shown in the Reyes and Steele studies, and the fall in incidence in the 50+ age group as shown in the Bakken study. Five broad explanations seem possible:
- The studies failed to reach older patients.
- There are disproportionately high levels of under diagnosis in older patients.
- ME/CFS has increased disproportionately in younger birth cohorts, in comparison to older birth cohorts.
- There are exceptional recovery rates in older age.
- ME/CFS patients experience notable levels of early mortality.
It seems unlikely that age promotes recovery and there is currently no evidence that ME/CFS patients are dying in exceptional numbers before the age of 70 however above average rates early mortality may be a reasonable concern. Although not recognised as such, the data could be used to argue that ME/CFS is an emergent disease of the second half of the 20th century that is only reaching stable prevalence as a prone younger population ages.
The fall in incidence in the post 50 age groups could be explained by early susceptibility – that is anyone who is susceptible to developing ME/CFS will have likely done so by a given age, the effect of this would be to make it appear that getting older is a protection against ME/CFS. The simplest explanation for the relative absence of older patients from the data is perhaps that older patients are less easy to identify and/or that older patients are less likely to have received a diagnosis of ME/CFS.
Younger patients
The study of ME/CFS in children and adolescents has entailed varying levels of controversy with studies reporting very wide ranges in figures for both Prevalence and Incidence. There is some general agreement that ME/CFS amongst pre adolescents is rare. The prevalence figures amongst young adults seem not to support findings of very high levels of ME/CFS amongst adolescents or must otherwise be explained by high recovery rates within the adolescent age range. It has been suggested that ME/CFS in the under 18s should be considered a separate condition from the disease that has onset in adulthood, however there is no data that strongly supports the proposal that exceptional chronicity does not apply equally to both adolescent and adult onset ME/CFS. There are many patient reports of adolescent onset ME/CFS lasting well into adulthood.
Patient gender
A significant feature of ME/CFS is that females are more prone than males with prevalence and incidence notably higher amongst women than amongst men.
Table 3
| Nacul 2011 | Reyes 2003 | Jason 1999 | Steele 1998 | Bakker 2014 | Nacul 2011 | |
| Prevalence | Prevalence | Prevalence | Prevalence | Incidence | Incidence | |
| F | 0.30 | 0.37 | 0.52 | 0.34 | 0.35 | 0.41 |
| M | 0.09 | 0.08 | 0.29 | 0.11 | 0.08 | 0.06 |
With the exception of Jason the figures in Table 3 all suggest a strong gender differential in the ME/CFS patient population, with four out of six columns giving a male to female ratio of between roughly 3:1 and 5:1. The mismatch between the Prevalence and Incidence figures given by Nacul are not easily explained but perhaps add to a general caution that while a gender differential exists, the scale of that differential may vary by geography and time.
Recovery data
The lack of data on recovery is a major inhibition to representing an approximation of a real world picture of a patient population. However a helpful statistical limit can be stated as “prevalence can not exceed lifetime incidence”. If the UK population of approximately 66 million is taken as the reference, then a Prevalence rate of 0.2% gives a patient population of 132,000. With an average UK life expectancy of approximately 80 years, and ME/CFS not manifesting in the first ten years of life, and allowing that age does not act as protective, then with an incidence rate of 0.015% we have a calculation that runs:
66m x 0.015% = 9,900 new cases per year divided by 132,000 as the maximum number of patients at any one time = 7.5% . This can be considered as an average annual recovery rate equivalent to a disease duration of 13.34 years; a minimum illness duration of 6 months yields a range of 0.5 – 26.2 years of illness per patient. It should be emphasised that this is just a statistical device – it does not represent the course of any individual patient’s illness or set any upper limit on the duration of the illness in any individual.
The UK ME/CFS Patient Population
The UK has well recorded demographic data [6] to which prevalence and incidence statistics derived from ME/CFS research can be applied to give a picture of what the UK patient population may look like.
Table 4
| Prevalence | Patient Population | New cases | Recovery rate | Avge Duration | Duration Range |
| (i) | |||||
| 0.20% | 131,703 | 9,878 | 7.50% | 13.3 years | 0.5 – 26.2 years |
| 0.24% | 154,751 | 9,878 | 6.38% | 15.7 years | 0.5 -30.8 years |
| 0.29% | 190,969 | 9,878 | 5.17% | 19.3 years | 0.5 -38.2years |
| 0.42% | 276,576 | 9,878 | 3.57% | 28.0 years | 0.5 -55.5 years |
| (ii) | |||||
| 0.20% | 131,703 | 11,853 | 9.00% | 11.1 years | 0.5 -21.7 years |
| 0.24% | 154,751 | 11,853 | 7.66% | 13.1 years | 0.5 -25.6 years |
| 0.29% | 190,969 | 11,853 | 6.21% | 16.1 years | 0.5 -31.7 years |
| 0.42% | 276,576 | 11,853 | 4.29% | 23.3 years | 0.5 -46.2 years |
| (iii) | |||||
| 0.20% | 131,703 | 18,768 | 14.25% | 7.0 years | 0.5 -13.5 years |
| 0.24% | 154,751 | 18,768 | 12.13% | 8.2 years | 0.5 -16.0 years |
| 0.29% | 190,969 | 18,768 | 9.83% | 10.2 years | 0.5 -19.9 years |
| 0.42% | 276,576 | 18,768 | 6.79% | 14.7 years | 0.5 -29.0years |
Table 4 shows the derived patient population, annual new cases, implied annual recovery rate, the implied average duration of illness and the potential illness range (6 months minimum) from matching the prevalence data (four studies) and incidence data ( three studies) given in Table 1. as applied to the UK population (mid year 2018 ). In simple terms if prevalence is fixed, new cases must be equivalent to recovered cases; higher incidence rates and lower prevalence rates yield higher recovery rates and shorter duration of illness for a notional average patient. Substantial chronicity is suggested for at least some patients and only the high incidence rates given by Bakken, matched to the low incidence rates given by Nacul and Reyes respectively suggest potential chronicity lasting less than 19.9 years.
The issue of chronicity is important because it further highlights the absence of older ME/CFS patients from study data. Even if the number of new cases of ME/CFS reduces from highs in younger age groups, it becomes challenging to explain falls in the Prevalence of ME/CFS in the over 50 age groups if chronicity of ME/CFS is measured in decades and new cases are being recorded up to the age of 60.
The Age Cliff
A range of illnesses are characterised by onset at different ages, however improvement of a chronic illness as a simple function of aging would seem to be rare and be a notable epidemiological feature. Epidemiological studies appear to suggest that the number of ME/CFS patients falls rapidly at one of two distinct ages, either at around 50 years or alternatively 60 years.
Models demonstrating the prevalence age cliff
Applying the data of Reyes, Jason and Steele to the UK population demonstrates the age cliff inherent in each study.
Model 1. Using the 10 year prevalence figures from Reyes 2003.

The 10 year age cohort figures (table 2) yield a total ME/CFS patient population for the UK of 106,508, this contrasts with using Reyes whole population figure (table 1) which gives 154,751 and 149,091 using the Reyes gender differential (table 3). The main feature of the chart is the dramatic fall in prevalence at the age of 60, this seems improbable when applied to the real world as it would suggest either thousands of patients are dying in their 60s or alternatively, are suddenly becoming well. Reyes did not record the figures for under 18 or over 70 age groups.
Model 2. Using the 10 year prevalence figures from Jason 1999

The 10 year age cohort figures yield a total ME/CFS patient population for the UK of 198,513, this contrasts with using the Jason whole population figure which gives 276,576 and 267,432 using the Jason gender differential. With the exception of a large peak in the 40 to 50 age group, the Jason figures suggest a somewhat even picture of between 2500 and 3500 patients per year group across 50 years from 20 to 70. Jason did not record the figures for under 18 or over 70 age groups.
Model 3. Using the 10 year prevalence figures from Steele 1998
The 10 year age cohort figures yield a total ME/CFS patient population for the UK of 113,649, this contrasts with using the Steele whole population figure which gives 190,969 and 148,899 using the Steele gender differential. Unlike Reyes and Jason, Steele included patients over the age of 70 and the chart shows a post 60 decline in numbers that is in part reflective of expected aging effects, however the falls from the pronounced peak at 50 are precipitous and if representative of the real world would require large scale recovery, exceptional mortality or major imbalances in levels of diagnosis. As with the Reyes and Jason studies, data was not recorded by Steele in the under 18s.
Bakken et al produced age related incidence data but no matching prevalence data and it is therefore not possible to apply Bakken to the UK population in the same way as the other studies. A useful model can be derived from the Bakken incidence data if it is allowed that the age data can be used to present a single lifetime chronicity model moderated by a notional recovery rate and applied to a defined number of years of potential illness exposure. The UK population data allows for statistically significant range from 0 – 89 years, which allowing no statistically significant number of patients under the age of 10 gives 78 years of potential illness exposure.
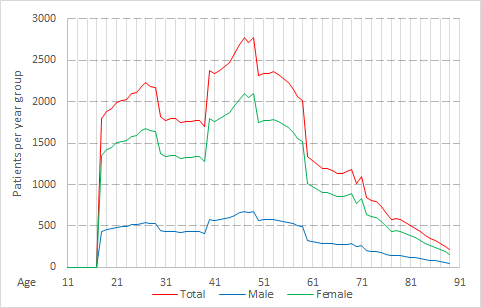
Model 4. Using Bakken 2014 Incidence data

Model 4 uses the Bakken 10 year incidence data, matched to a notional annual recovery rate taken as the average of those given in the fourth column of Table 4 above (7.73%), to produce a picture of age distributed prevalence in the UK population. The (green) line showing Incidence post 60 is constructed by treating the incidence given by Bakken for the 50-59 age group (0.014%) as a consistent measure across the entire 60-89 age group; the even decline is broadly in line with expected mortality. The (red) line showing Incidence to age 60 allows no new cases in the 60+ age group and the faster rate of decline is a function of no new cases, with pre-existing cases sequentially reduced by 7.73% annual recovery rates and normal mortality.
A key characteristics of model 4 is how the weight of patient numbers is distributed between younger and older age groups. With new cases continuing to arise in the over 60s over half the patient population would be aged over 46 and a quarter are aged over 60. With all new cases ceasing at age 60, still half of the patient population would be aged over 42, a quarter over 55 and 17% over 60 with several thousand patients in their 70s and 80s.
Implications
The lack of data on ME/CFS patient populations is a serious hindrance to both the understanding of the illness and to effective targetting of help and support to patients. If the age cliff as suggested by prevalence studies is a real feature rather than a statistical or research artifact, then it is a feature that needs to be properly explored. The age cliff suggests some fundamental characteristics of ME/CFS are correlated to patient aging and such correlation requires either exclusion from relevance, or detailed investigation.
If the number of new cases of ME/CFS does decline with age following a peak at some point in the 40 to 60 age group, then in broad terms either aging is in someway protective against developing the condition or otherwise susceptibility has selected out those who are likely to develop the condition, by around 60 years of age. Although protective aspects of aging may seem improbable there may be reasons of biology or of environmental exposure that could explain why those over a certain age are excluded from development of ME/CFS. If they were to be real phenomena then such aspects would likely be key to understanding the illness.
In addition to falls in Incidence rates, reductions in Prevalence across age groups would be affected by changes in recovery rates and mortality. As an explanation for a rapid post 50 years of age fall in prevalence, accelerated recovery would imply a highly significant somatic effect that would demand investigation. In such a case it would not be a matter of age being protective or beneficially selective. For prevalence to be impacted either aging would have to provide a curative effect irrespective of illness duration, or the course of disease in patients with onset at 40+ years of age would need to be characterised by reduced chronicity when compared to illness onset in younger age groups. In the absence of other explanations for age correlated decline in ME/CFS prevalence, excess early mortality amongst ME/CFS patients must be a concern which demands research attention.
Post 50 years of age correlated falls in Prevalence rates could be explained by ME/CFS being an emergent disease which is only now reaching stable prevalence as a prone or exposed population ages. If this were to be the case then prevalence amongst older age groups would be expected to increase over the coming decades to more closely match the rate found that amongst younger age groups. As an emergent disease ME/CFS would likely warrant radically different approaches toward investigation than those currently being pursued, however there is no categoric evidence to suggest ME/CFS is of recent emergence.
Summary
Epidemiological data on ME/CFS is limited, such data that does exist suggests that there are substantial gaps in the knowledge of how the course of ME/CFS is affected by aging, and in how older populations are impacted by the disease. Additionally existing data suggests substantial chronicity in numbers of patients, including those over the age 50, such that in the UK over half the ME/CFS patient population is likely to be over the age of 40 and that the disease affects notable numbers of older patients who are routinely excluded from research, appropriate medical care and systems of support.
References
- Bakken, Tveito, Gunnes, Ghaderi, Stoltenberg, Trogstad, Håberg & Magnus 01 October 2014. Two age peaks in the incidence of chronic fatigue syndrome/myalgic encephalomyelitis: a population-based registry study from Norway 2008-2012 https://bmcmedicine.biomedcentral.com/articles/10.1186/s12916-014-0167-5
- Nacul, Lacerda, Pheby Campion, Molokhia, Fayyaz, Leite, Poland, Howe, & Drachler. Published: 28 July 2011. Prevalence of myalgic encephalomyelitis/chronic fatigue syndrome (ME/CFS) in three regions of England: a repeated cross-sectional study in primary care. https://bmcmedicine.biomedcentral.com/articles/10.1186/1741-7015-9-91
- Reyes, Nisenbaum & Hoaglin, July 14, 2003. Prevalence and Incidence of Chronic Fatigue Syndrome in Wichita, Kansas https://jamanetwork.com/journals/jamainternalmedicine/fullarticle/215827
- Jason, Richman & Rademaker October 11, 1999. A Community-Based Study of Chronic Fatigue Syndrome https://jamanetwork.com/journals/jamainternalmedicine/fullarticle/415556
- Steele, Dobbins, Fukuda, Reyes, Randall, Koppelman & Reeves 1998 Sep 28 The epidemiology of chronic fatigue in San Francisco https://www.ncbi.nlm.nih.gov/pubmed/9790487
- Office for National Statistics United Kingdom population mid-year estimate 2018 https://www.ons.gov.uk/peoplepopulationandcommunity/populationandmigration/populationestimates/timeseries/ukpop/pop
